We did it! We travelled the world for a whole year! In the spirit of Lattes & Runways, we celebrated our One Year Travelversary in Luxembourg with the most delicious almond milk latte of all time. Then we watched the Brazil v. Mexico World Cup soccer match at a pub and talked about how — you guessed it — the world is more alike than different. It was a perfect day.

The longer we travel, the more fun it is to compile our quarterly Travel by Numbers scorecard. It’s one of my favorite things to do for this blog, and I hope you enjoy reading it! I love collapsing all of our travel days into one pretty little package and watching the numbers climb as the quarters tick by.
Let’s talk money, honey.
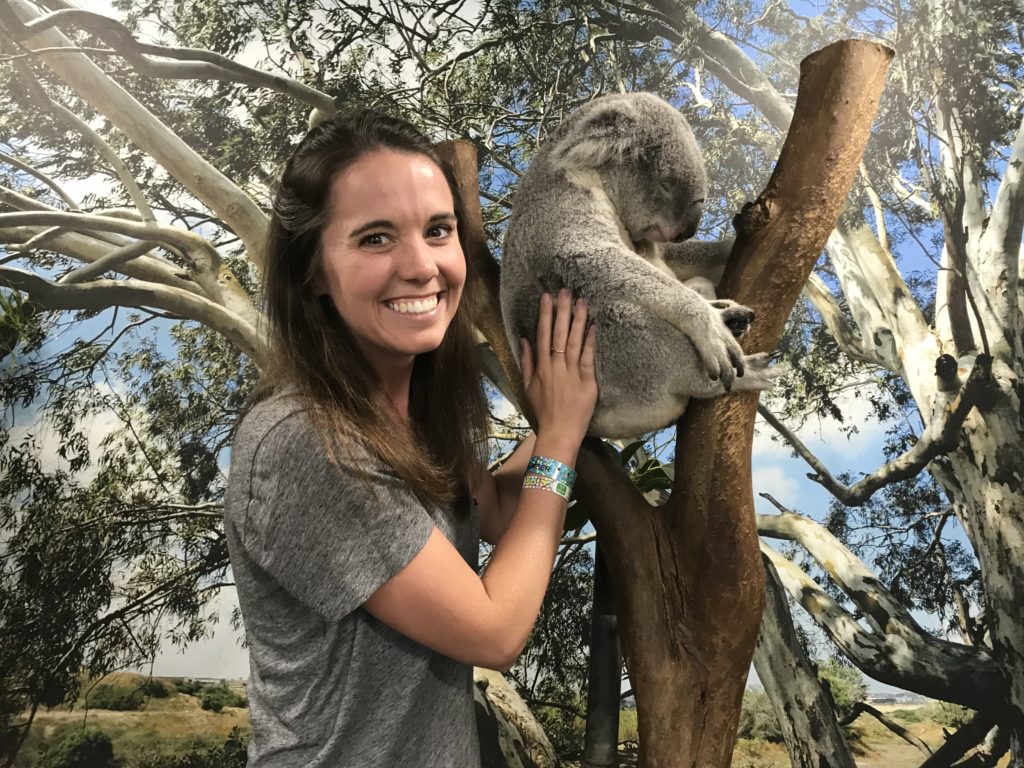
What stands out most about this last quarter was how much money we spent. Over the past three months (April 2 – July 1), we racked up a whopping $18,257 in expenses. Making it our most expensive quarter. This quarter was tough because it included heavy budget hitters like Hawaii, Australia and London. A month in Egypt & Morocco helped cut costs, but we still managed to make these cheaper destinations expensive by going on pricy tours (like a Nile Cruise & Glamping in the Sahara).
Our average spending per day in Q4 was the highest it has ever been at $228 per day. That’s $67 per day more than our previous highest quarter, which was Q3 at $161 per day. (These “per day” costs include all travel expenses including transportation, accommodation, food, etc.)
Significantly, this was the first quarter we went over our trip budget of $200 per day. The good news though is that since our first three quarters were so far under budget (coming in at $153, $147, $161 per day), our average daily spending for the year came in at $189 per day. We’re officially still under budget!
The other thing that took the sting out of our expensive quarter is the fact that we’re both making money. Though we’ve both been generating an income (blogging & remote work) since Q2, we really started to hit our stride in Q4. Having the extra money makes it easier to spring for the Airbnb instead of the hostel or ordering that extra beer. So we did spend more, but we still ended up making more money than we spent in Q4. So that’s nice!
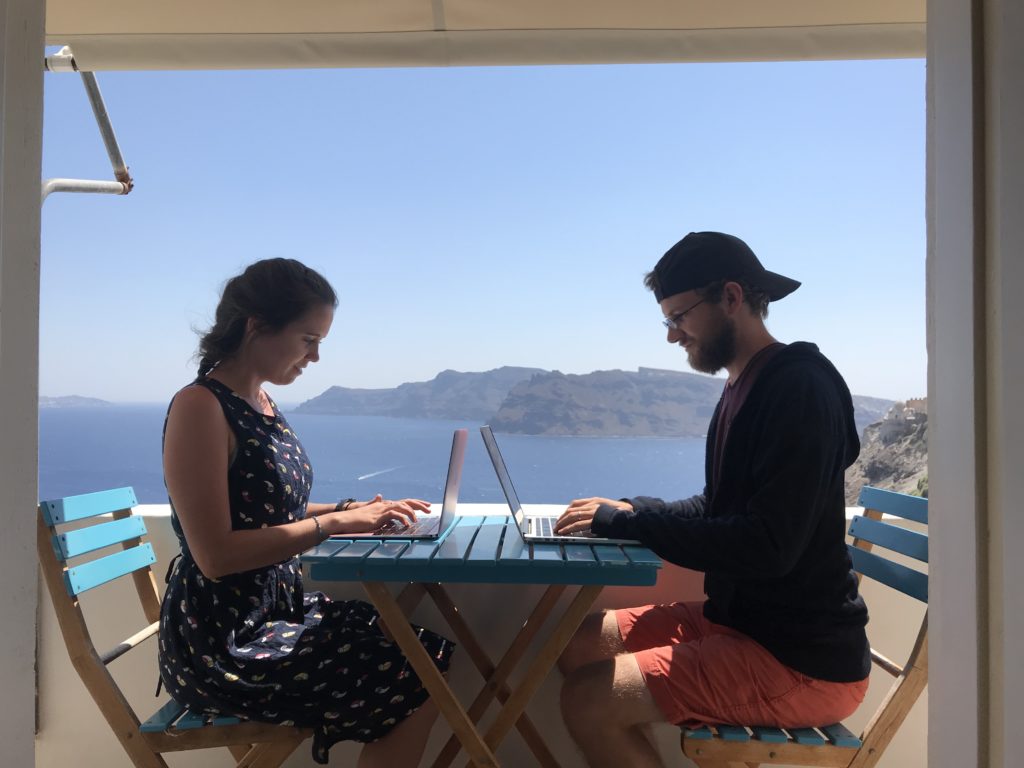
Why do we keep losing things?!
You might have noticed that we’ve always had a stat for things we’ve lost, and in our 6-month recap we also added a count of things we found. We consider an item “lost” when it has left our possession, unintentionally and not by force, and is in the possession of someone else.
The number of things we’ve lost, currently sitting at 12, is not particularly high for a year of travel, but the actual items we’ve lost is astounding. I’ve included the list below because it’s crazy how many valuable items we’ve lost. We’re talking passports, my laptop and credit cards — pretty much everything important we have with us we’ve lost at some point. Fortunately, the most valuable items we’ve lost have been found (like my laptop). Also, the number of times Kenny has lost his hat(s) is just comical.
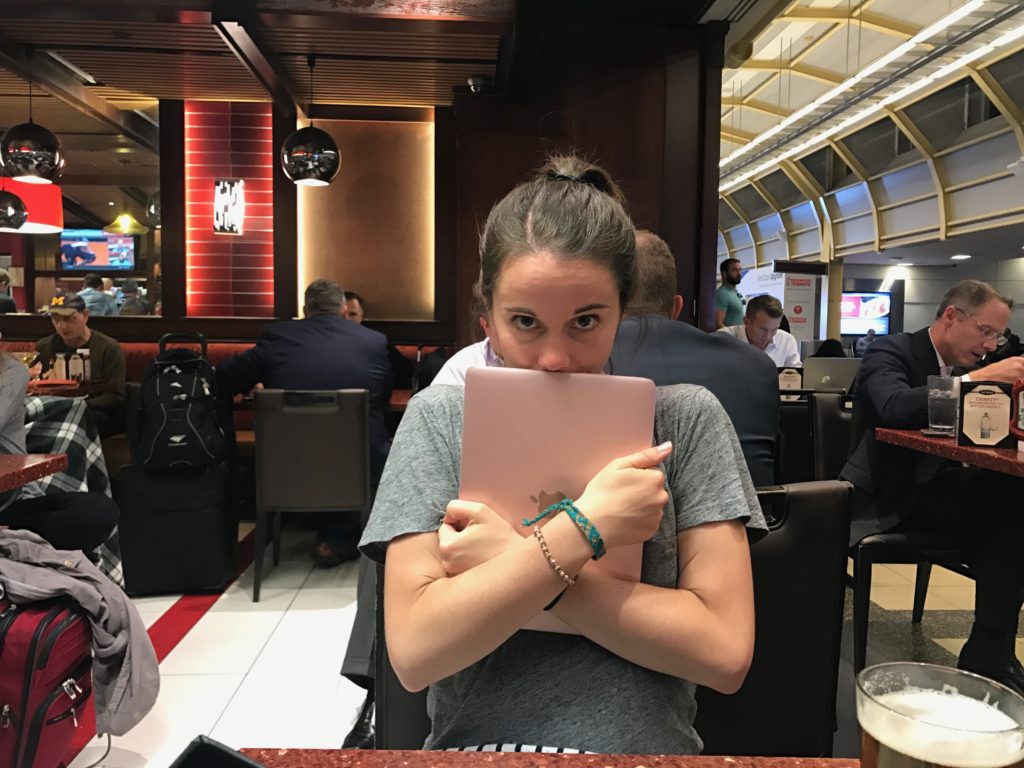
Anyway, I don’t know why we’re so bad at keeping track of our stuff.
Items Lost Over the Past Year of Travel
Recovered items marked with (*)
- Ironman Hat lost on Everest ride at Disney’s Animal Kingdom | Kenny
- Wallet with no money or cards lost on a plane to Lima, Peru | Emily
- Wallet with money and cards lost somehow in the chaos of missing our train after hiking the Inca Trail | Kenny
- Water Bottle lost on a bus to Salento, Colombia | Kenny
- Laptop* lost on a plane to Washington, D.C. | Emily
- Credit Card lost at Shanghai Disneyland | Kenny
- Passports and jackets* in a drawstring bag lost at Shanghai Disneyland | Emily
- Hiking Boots* lost at Maerim Elephant Sanctuary in Chiang Mai, Thailand | Emily
- Tank Top lost somewhere in Laos | Emily
- Charging Chord lost somewhere and sometime | Kenny
- Mickey Hat lost in a cab in Beirut, Lebanon | Kenny
- Replacement Mickey Hat* lost in a pub in London, England | Kenny
Coffee, Coffee, Coffee
We have learned a lot about coffee around the world. Q4 was the first quarter that we couldn’t rely on working from coffee shops everyday. This was a hard transition considering the fact that we worked from coffee shops nearly everyday for the first nine months of this trip.
It became difficult to find coffee shops with wifi, outlets and space, especially in the Middle East and Europe. We eventually we stopped looking. So instead of working from coffee shops, we started eating at them.
London, Sydney and most of Europe have a great cafe scene with delicious breakfast options. We actually hate eating lunch, so we started eating breakfast instead. We have come to love combining a meal with our coffee shop time. Sometimes we even just get coffee and chat. It’s nice!
This actually has nothing to do with our data; I just thought I’d share. Our coffee data is actually very uninteresting this quarter. When it comes to coffee, we’re nothing if not consistent. In 365 days of travel, we’ve ordered 312 coffees (each) at 229 cafes. The remaining 53 days of the year we either made coffee at home or otherwise had coffee provided to us without ordering from a cafe or restaurant.
We’ve taken a lot of photos
During the first month of our trip, we were in Salento, Colombia and met another American couple who were 8-months into their own year-long trip around the world (hi Lesley and Trevor!). We met them at a Tejo bar, but Salento is a small town and our paths continued to cross, including on our hike in Cocora Valley.
We asked if they’d take a few pictures of us, and in return, we offered to take photos of them. He was clearly a photographer so we felt a bit of pressure to take good photos. After taking the photos, we asked them to check them out and to be sure they were okay. Lesley laughed and said something along the lines of, “I’m sure they’re fine. We have a lot of photos.”
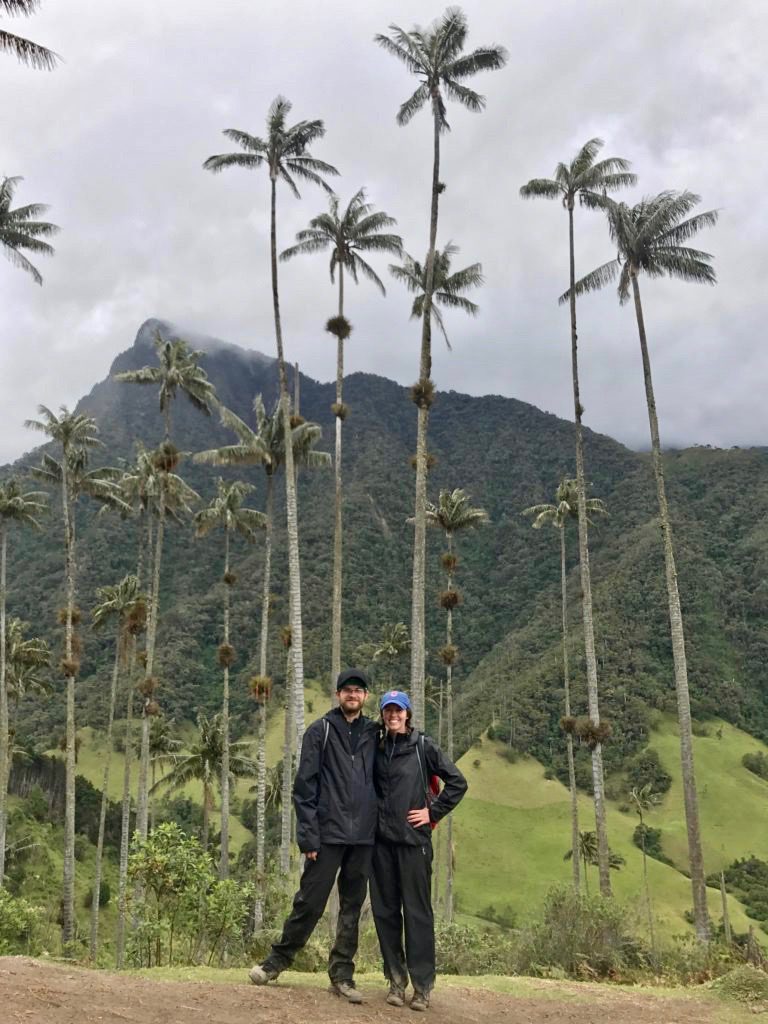
At the time, I was a little shocked that they weren’t set on getting the perfect photo at the highlight of this hike. Now, I completely get it. We also have a lot of photos now. Over the past 12 months, we’ve taken 26,172 photos.
Of those 26,172 photos, I have posted 217 on Instagram, 240 on Facebook, used about 400 in photo books, and posted roughly 1,500 here on Lattes & Runways. The truth of the matter is just that we cannot possibly consume all of these photos. We of course continue to take a ridiculous amount of photos, but we put a lot less pressure on ourselves to always get the perfect one.
Travel by Numbers — 12 Months of Traveling the World
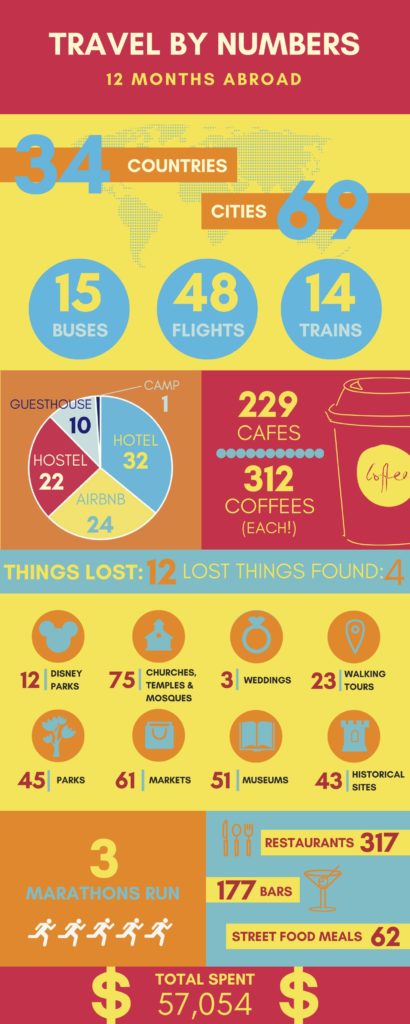
So what do you think? Do any of our stats surprise you? What do you think we’re missing? Let us know in the comments and I can probably at it!

Frank Melgreen
Saturday 28th of July 2018
Continue to enjoy yourselves. Your stats are always fun.