I’ve collected a lot of things over the past nine months of travel. I’ve got t-shirts from every country, coins in every currency, and thousands of rows of data. Across +20 workbooks, we have meticulously tracked every aspect of this trip. We can tell you how many miles we’ve flown (62,176), how many times we’ve walked up a hill for a view (12) and where we ate dinner on January 11 (Namaste Indian in Vientiane. We eat a lot of Indian — 30 times to be exact).
By trade, I work in recruiting operations. Of the many hats I get to wear in my job, my favorite is that of report builder. I love building reports that help my team work more efficiently and scorecards that showcase the impact we’ve had on the business. And if I enjoy producing reports with hiring data, you can see why I would love having the opportunity to work with a data set as fun as travel stats.
Since we started traveling in July 2017, every three months I produce a Travel By Numbers stats sheet. (I refer to these three-month blocks as quarters, starting with JUL – SEP as Q1.) If you haven’t checked them out yet, you can view our Q1 stats here and our Q2 stats here. You can also fast forward to our Q4 stats here!
This quarter was particularly fun because I’ve finally gathered enough data to look at some trends and do a little bit of analysis. So if you’re interested in that, you can read my rambling analysis below. Or I won’t be offended if you just want to jump to the infographic.
Analysis
We’re hitting more cities.
Our city count really skyrocketed this quarter as we hit 23 cities! This is almost twice as many cities as we visited in Q1, when we made it to 12 cities. As a result though, our average days per city plummeted to 4, compared to Q1 when we averaged 7 days per city.
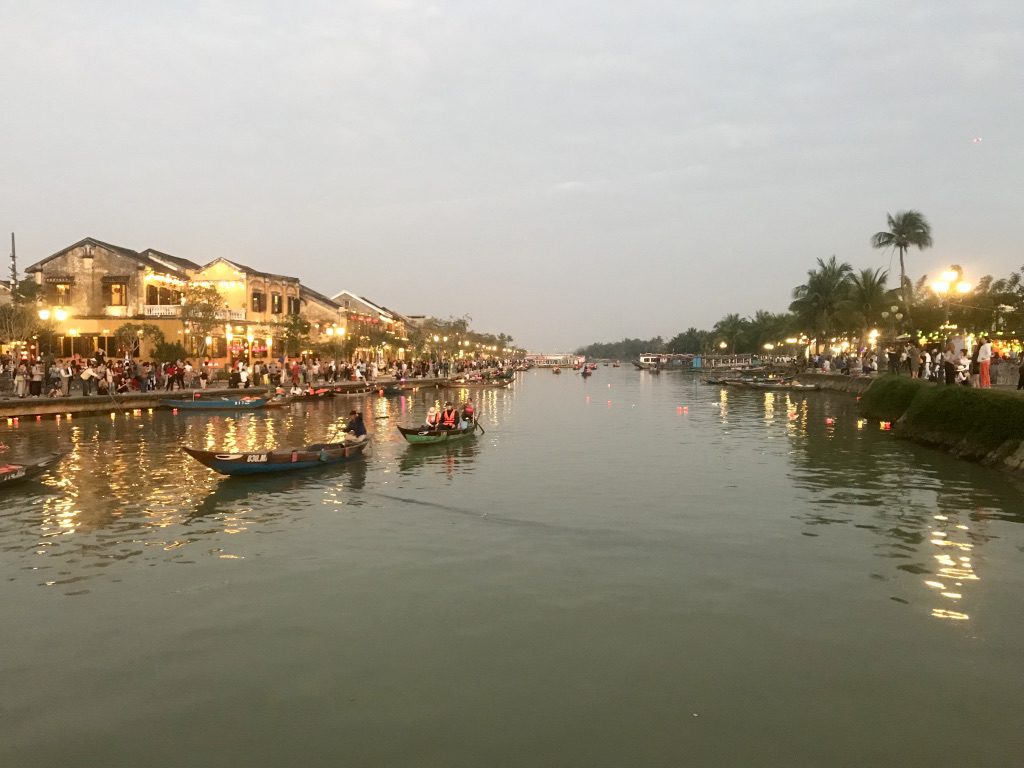
We went to six different cities as we made our way south through Vietnam, one of our favorite countries. We spent three nights in the riverside town of Hoi An, where people gather nightly to see the streets lined with lanterns and send candles floating down the river.
We’re spending more time in each country.
While we spent fewer days in each city, we visited more cities in each country. On average in Q3, we visited 3.3 cities in every country, compared to Q1 and Q2 which was only at 1.7 and 1.8 cities per country respectively. This resulted in an increase in our average days spent in each country, which in Q3 averaged about 11 days per country compared to 7 days in Q2. This is not quite as high as Q1, though, when we were averaging 13 days per country.
We’re adjusting our spending patterns by city.
Our spending quarter-over-quarter has remained almost eerily consistent. Q3 total spending of $12,553 was only $344 higher (<3%) than our Q2 total spending of $12,208.78. We’re very budget driven and try to balance our activities with the cost of living in any particular city to keep our spending even. For example, we ate at restaurants nearly twice as often in Q3 (99 times) than we did in Q1 (only 49 times). That’s because we were in Southeast Asia for much of Q3 where the cost of buying meals was as much as the cost to cook our own in South America in Q1. We only went to a bar 2 times during our 9 days in Tokyo, where the cost of a beer was >$10 USD, compared to Siem Reap where we went to a bar 6 times over only 4 days when the cost of a beer was <$1 USD.
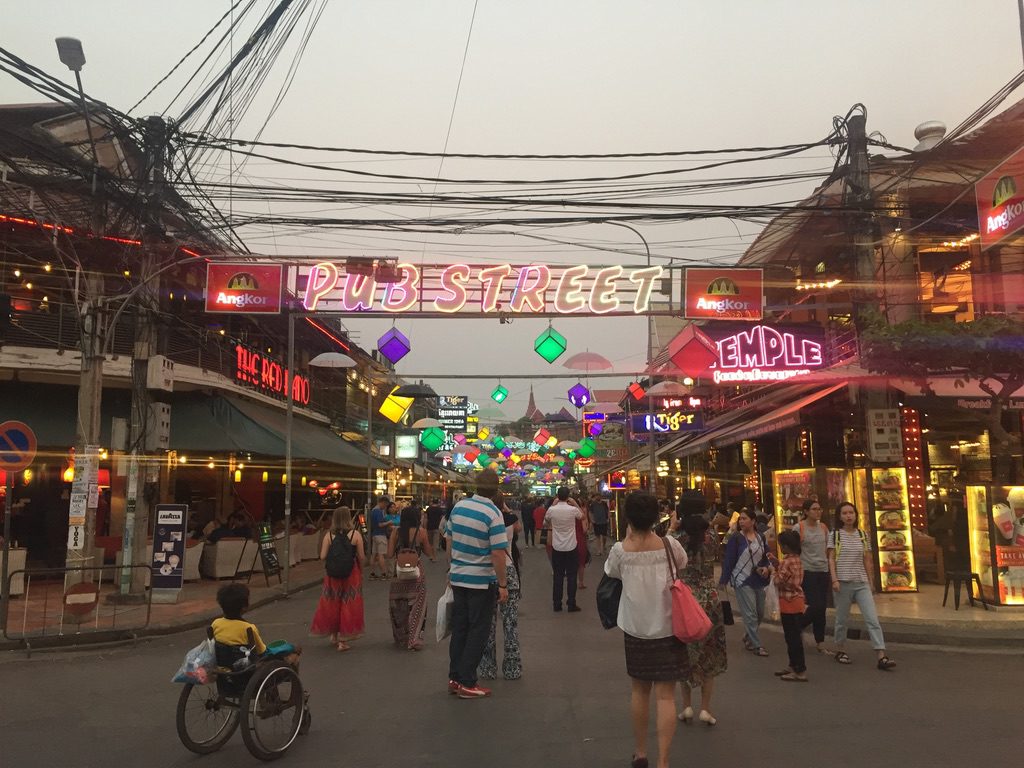
Pub Street is a lively street in Siem Reap that is always buzzing with travelers in town to see the famed Angkor Wat. Happy Hour beers were $0.75 and full priced beers were about $1.50.
We’re on budget.
Our average daily spending in Q3 was at $160.94 (for both of us), which is almost exactly our target budget of $80 per person per day. This was our most expensive quarter, compared to our average daily spending of $152.57 in Q1 and $147.09 in Q2. While Q3 did include a lot of Southeast Asia, it also include Beijing, Japan, Singapore, London and Chicago, which are all much more expensive destinations. For reference, this number includes the cost of accommodations, transportation (including flights), meals, drinks and activities, but excludes things like supplies (backpacks, hiking shoes, etc.) and certain deluxe expenses like Disney spending.
We’re going to more coffee shops …
This quarter we tried to make an effort to visit different cafes every day, instead of making multiple visits to the same one. We were successful in this endeavor and had our highest number of cafes visited in a quarter, at 66 (compared to 42 in Q1 and 59 in Q2). This was helped out by the fact that our travel speed picked up, and we weren’t hanging around in cities long enough to visit the same cafes too many times, anyway. (We’ve learned a lot about coffee around the world this quarter!)
… but we’re ordering fewer coffees.
Despite visiting more cafes, we actually ordered fewer total coffees this quarter (74 each) compared to Q2 when we ordered a whopping 87 coffees each! This actually makes sense considering the last three weeks of Q2 was spent in Thailand. There, coffees were so cheap and there was little else to do so we started getting afternoon coffee on top of our morning coffee.
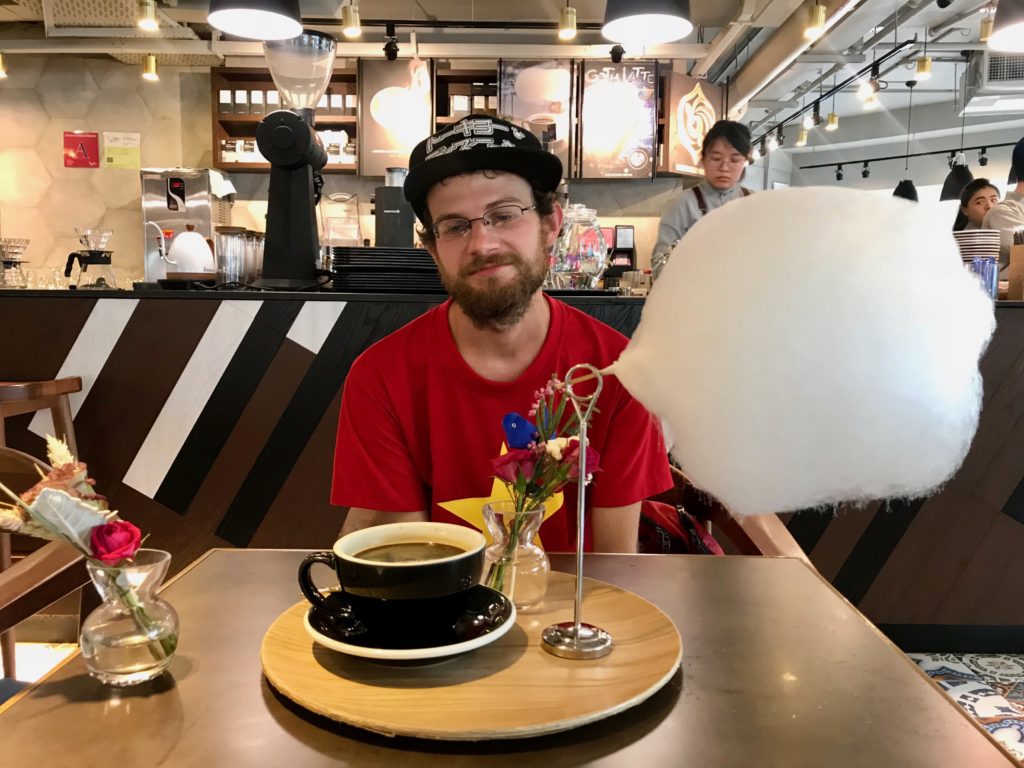
Out of the 239 coffees Kenny has ordered, this one is probably his only #coffeefail
Why do we still not have as many coffees as there are days? This stat only tracks coffees ordered at cafes and excludes coffees we made in our hotel, purchased at a street vendor, received as part of a tour, things like that. Don’t worry, we’re drinking coffee every day.
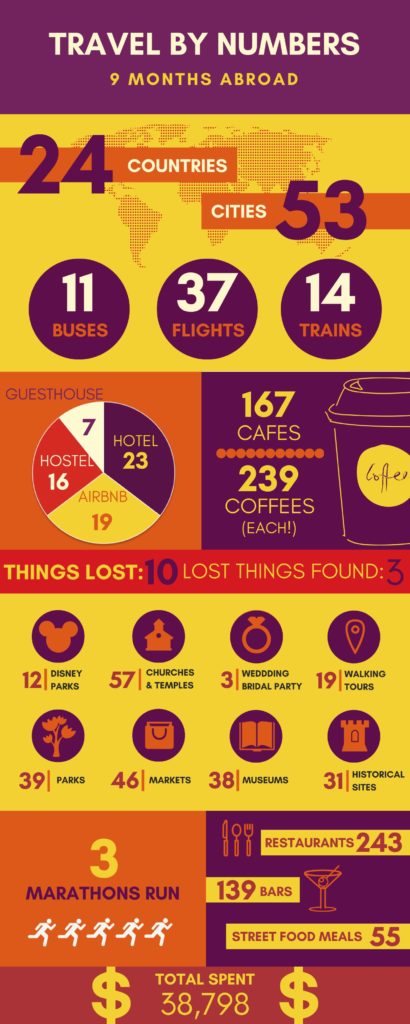
Travel by Numbers — 9 Months of Traveling the World
So what do you guys think? Do any of these numbers surprise you?
Jill DiGiovanni
Monday 30th of April 2018
Impressive! What an amazing adventure. Cheers to 139 bars and please explain 3 marathons?!?! Did one of you actually run marathons?
Emily
Sunday 6th of May 2018
Thank you, Jill!! Yes! We both ran three marathons: Chiang Mai, Budapest and Tokyo! Training while traveling was tough, but we somehow managed to cross the finish line three times!